
This article has not been completed yet. However, it may already contain helpful Information and therefore it has been published at this stage.

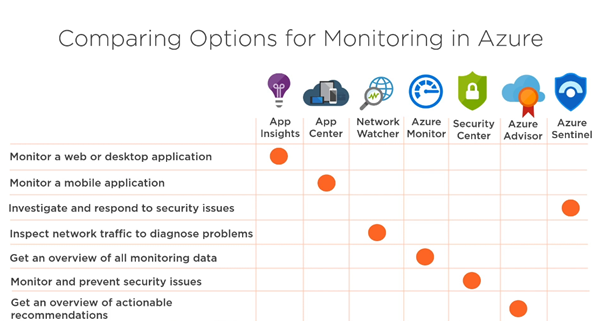
What is Azure Monitor?
"Azure Monitor helps you maximize the availability and performance of your applications and services. It delivers a comprehensive solution for collecting, analyzing, and acting on telemetry from your cloud and on-premises environments."
Use-Cases:
- Detect and diagnose issues across applications and dependencies with Application Insights.
- Correlate infrastructure issues with VM insights and Container insights.
- Drill into your monitoring data with Log Analytics for troubleshooting and deep diagnostics.
- Support operations at scale with smart alerts and automated actions.
- Create visualizations with Azure dashboards and workbooks.
- Collect data from monitored resources using Azure Monitor Metrics.
High - Level Overview:
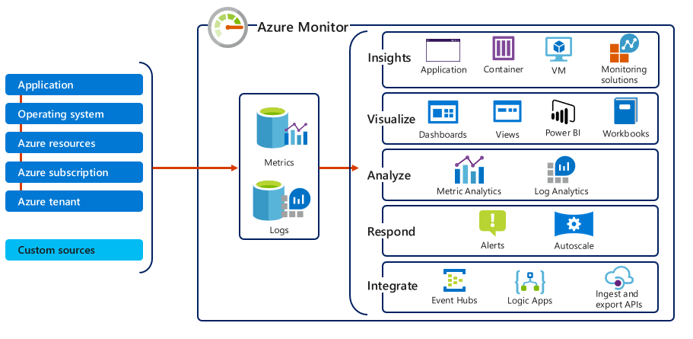
Sources:
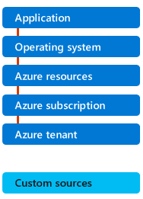
Sources that can be used by Azure Monitor.
Datastores:

The data collected by Azure Monitor can be divided into two basic types and are stored in different storage spaces.
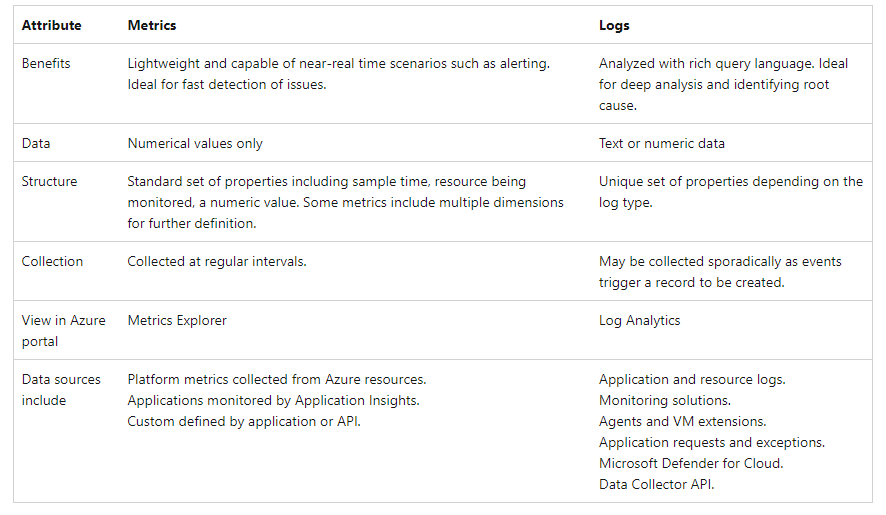
Metrics - Metrics are numerical values that describe some aspect of a system at a particular point in time (e.g. CPU, Network, and Disk) stored in time series database (for 93 days).
Logs - Logs are events that occurred within the system. They can contain different kinds of data and may be structured or free form text with a timestamp.
Metrics vs. Logs:
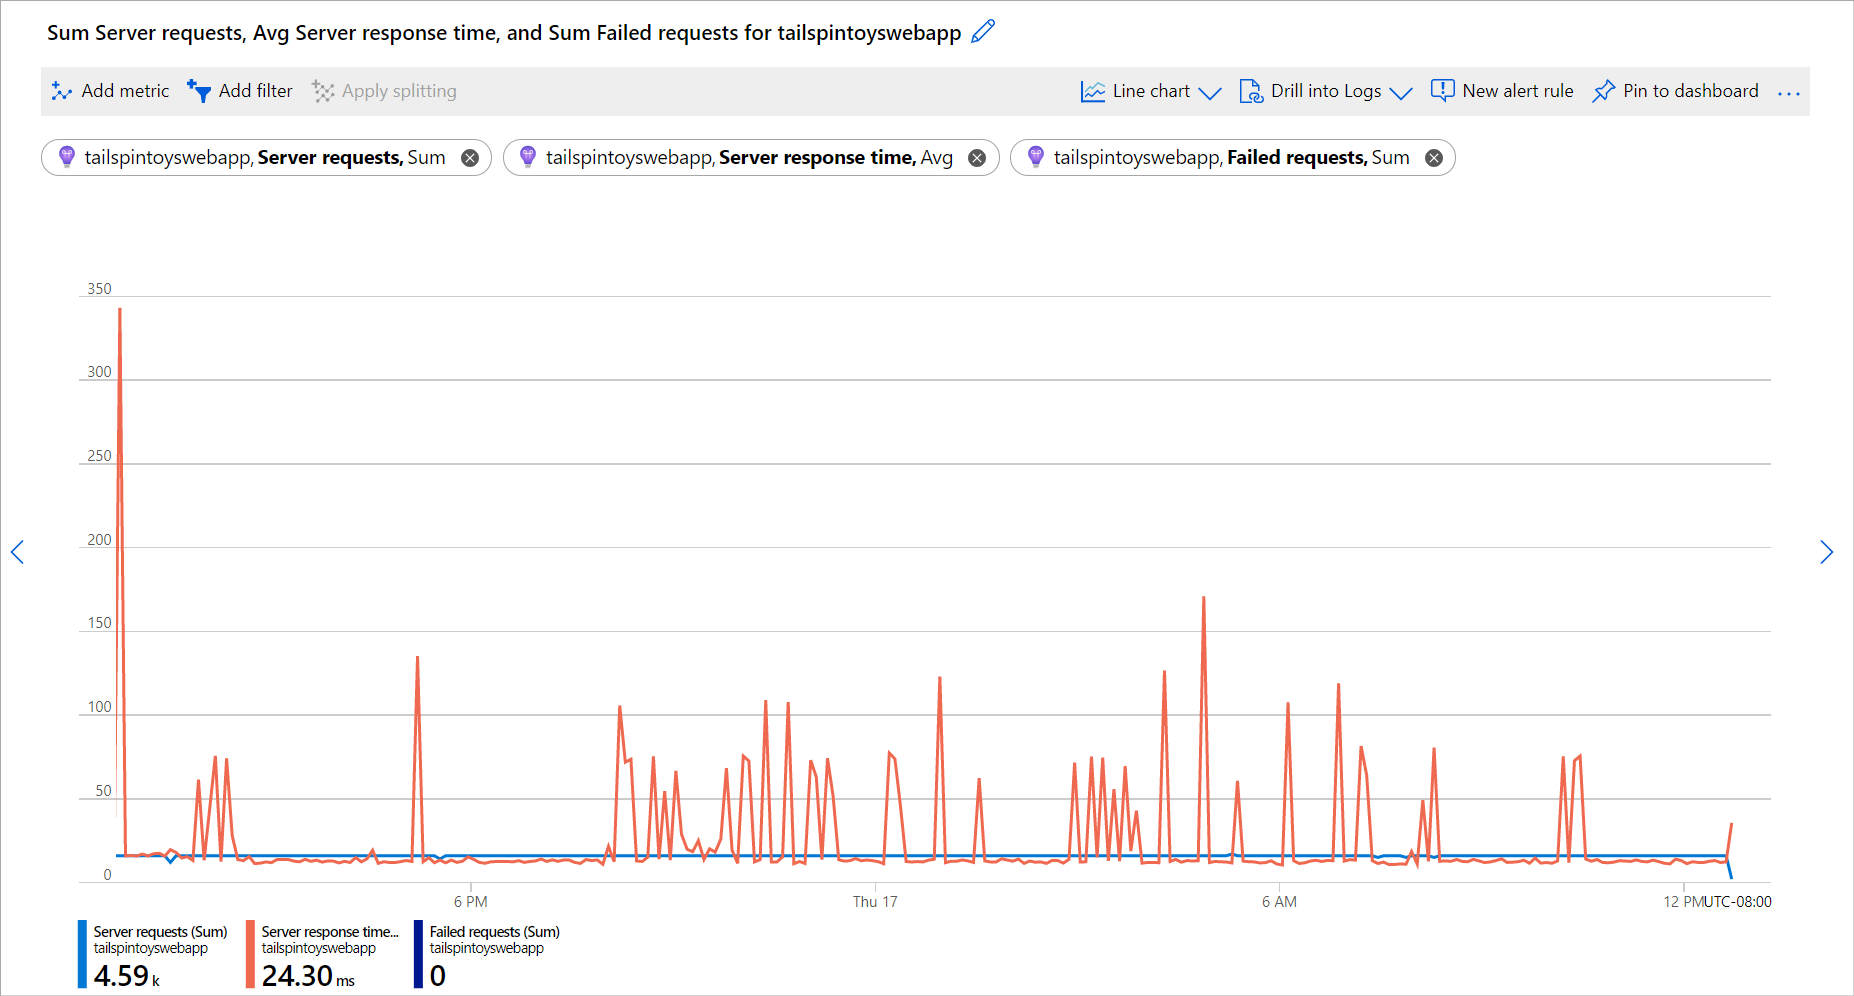
Metrics Explorer:
Functions:
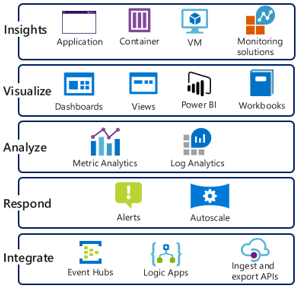
- Insights
- Visualize
- Analyze
- Respond
- Integrate
References:
https://blog.atwork.at/post/Monitor-overview-of-Azure-services


Monitor your networks using Azure monitor - Learn | Microsoft Docs

