


This article has not been completed yet. However, it may already contain helpful Information and therefore it has been published at this stage.
Setting up the environment:
Return to the Dataexplorer and the Cluster, you created in the onboarding challange:
https://dataexplorer.azure.com/home
Script to be executed:
.execute database script <|
// Ingestion may take ~40sec to complete, total 5M+ records
.create-merge table Votes (Timestamp:datetime, vote:string, via_ip:string, voter_hash_id:string)
.ingest async into table Votes (@'https://kustodetectiveagency.blob.core.windows.net/digitown-votes/votes_1.csv.gz')
.ingest async into table Votes (@'https://kustodetectiveagency.blob.core.windows.net/digitown-votes/votes_2.csv.gz')
.ingest async into table Votes (@'https://kustodetectiveagency.blob.core.windows.net/digitown-votes/votes_3.csv.gz')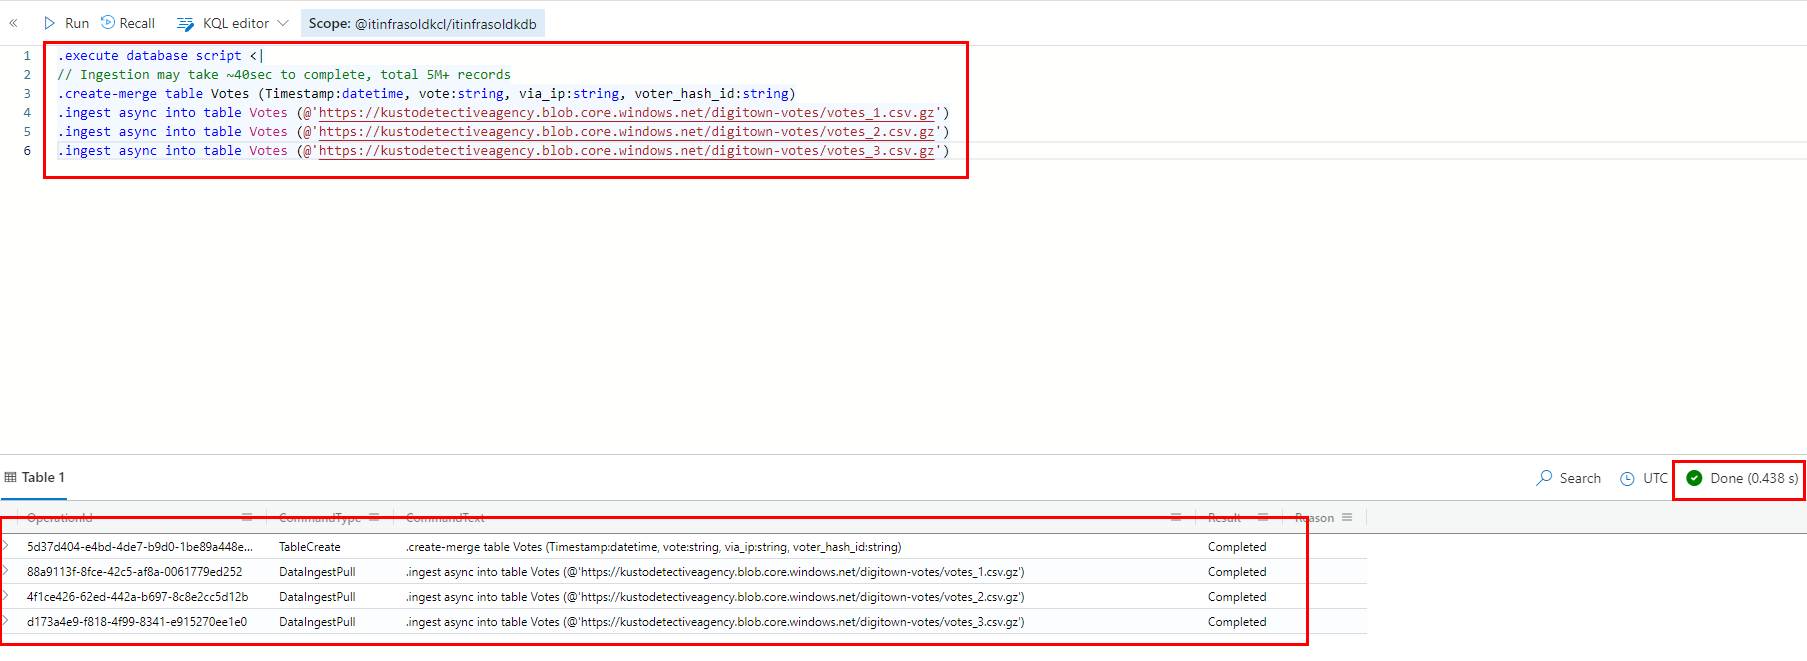
// Query that counts the votes:
Votes
| summarize Count=count() by vote
| as hint.materialized=true T
| extend Total = toscalar(T | summarize sum(Count))
| project vote, Percentage = round(Count*100.0 / Total, 1), Count
| order by Count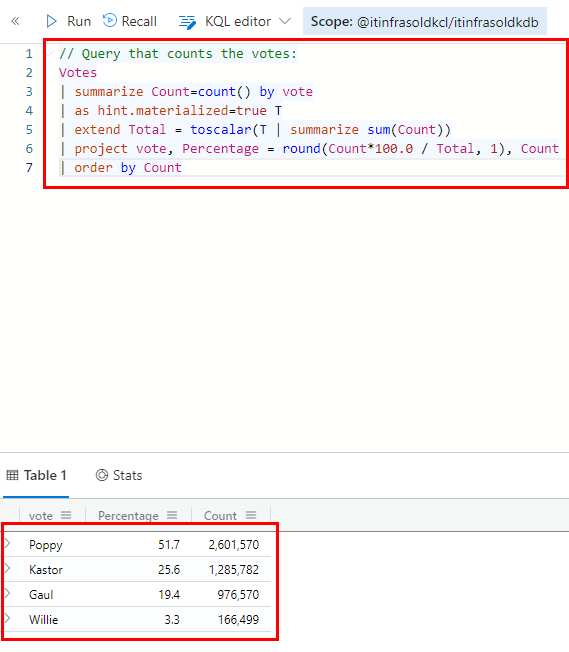
The Challenge:
The mayor of Digitown, Mrs. Gaia Budskott, has found herself in quite a pickle. The election for the city’s mascot was run online for the first time, and it was a huge success! Or was it??
Over 5 million people voted. Four candidates made it to the final round:
- Kastor the Elephant – The darling of Digitown Zoo
- Gaul the Octopus – A Digitown celebrity, who was a whiz at predicting who’d win the local soccer games
- William (Willie) the Tortoise – Digitown’s oldest living creature (estimated age - 176.4 years)
- Poppy the Goldfish – ex-Mayor Jason Guvid’s childhood pet
The polls predicted a close battle between Kastor and Gaul, but the actual results showed that the ex-mayor’s fish got a whopping 51.7% of all votes! That sure does sound fishy...
The mayor is afraid of a vote-tampering scandal that could affect all elections in Digitown! You’ve helped her out last time, and she’s counting on you to get to the bottom of this mystery.
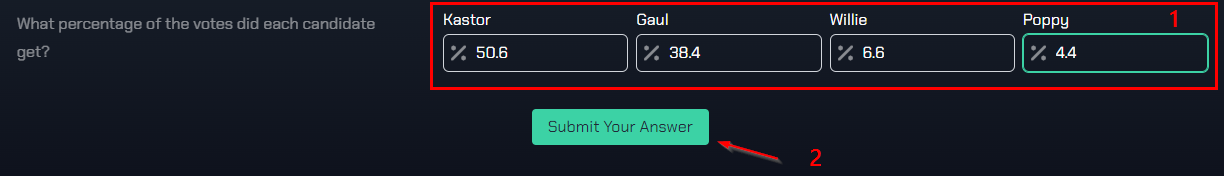
If voting fraud happened – prove it and correct the election numbers: what percentage of the votes did each candidate get?
You have access to the elections data: IP, anonymized id, vote, date-time - and the function used for counting the votes.
Good luck, rookie. We’re counting on you.Info: Each challenge has up to three hints that can be accessed through the hints section of your Detective UI.
Query Hint:
To solve the challenge, you need to find out if any of the votes are invalid, and if so, remove them from the results.
KQL commands that will be helpful are anomaly detection, particularly series_decompose_anomalies and bin, alternatively you can also make use of format_datetime and a little bit of guesswork.
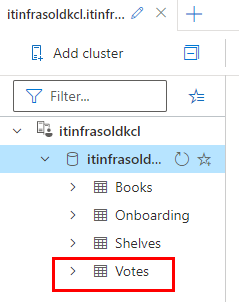
Table Analysis:
Tables to be used for this task:
# Show 10 entries of the Votes table

Votes | take 10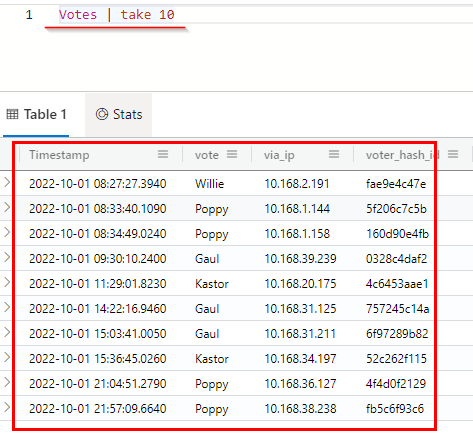
Based on the datastructure it seems appropriate to break down the number of votes for each candidate for each hour and IP address.
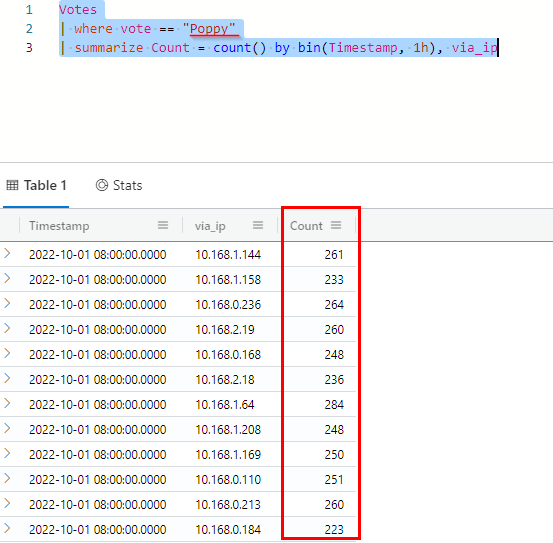
# Show the number of votes for a given candidate according to an hourly
# timerange and ip address

Votes
| where vote == "<candidate>"
| summarize Count = count() by bin(Timestamp, 1h), via_ip
Results for Poppy:
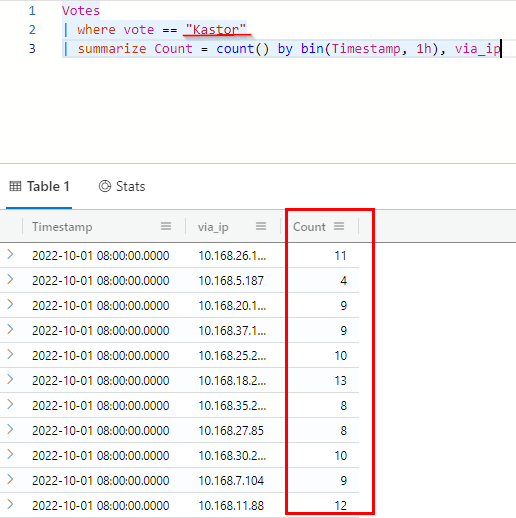
Results for Kastor:
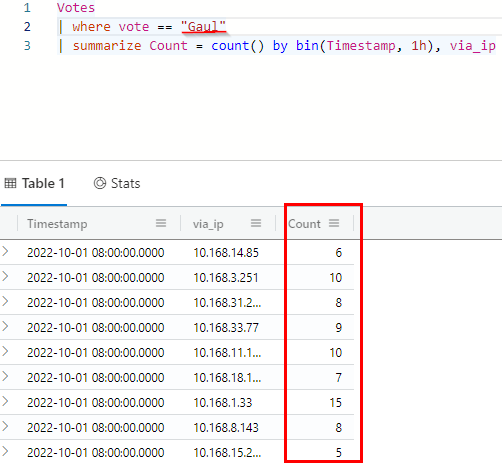
Results for Gaul:
Results for Willie:
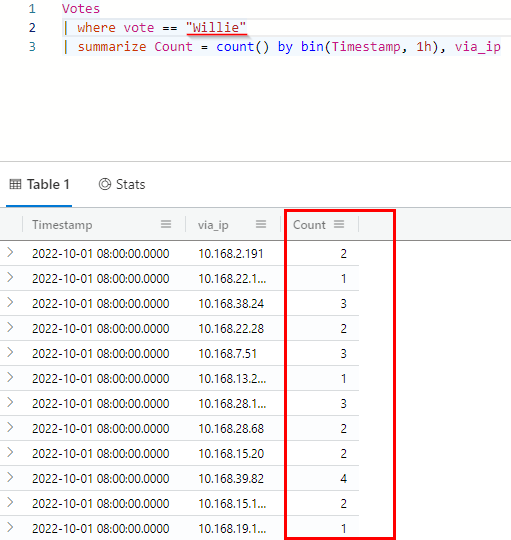
One can clearly see that Poppy's result differs significantly from the competitors' results. Therefore, we now concentrate our analysis on the candidate Poppy.
Let's expand the analysis and look at this from the perspective of the IP addresses.
# Show all IP addresses and the votes transmitted through them, in the
# matching time windows of 1h

Votes
| where vote == "Poppy"
| summarize Count = count() by bin(Timestamp, 1h), via_ip
| summarize votesPoppy = make_list(Count), Timestamp = make_list(Timestamp) by via_ip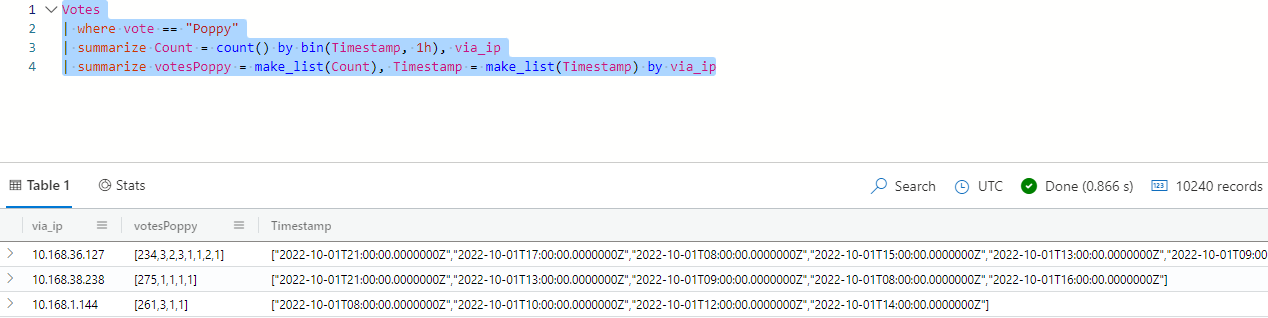
With this prepared data structure, it is now possible to further examine it for anomalies. This should be easy using the series_decompose_anomalies() function:
# Examine the processed data for anomalies and return the findings by an
# additional outlier column.

Votes
| where vote == "Poppy"
| summarize Count = count() by bin(Timestamp, 1h), via_ip
| summarize votesPoppy = make_list(Count), Timestamp = make_list(Timestamp) by via_ip
| extend outliers = series_decompose_anomalies(votesPoppy)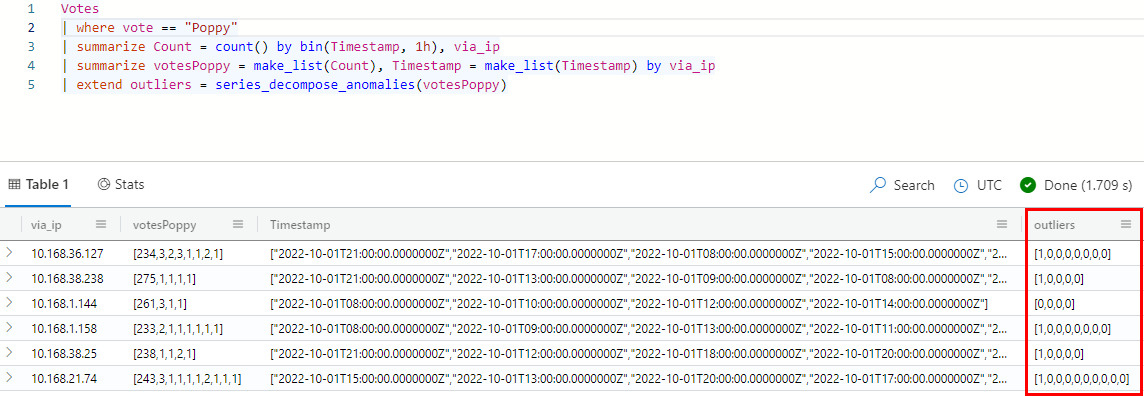
In every case where an anomaly was found, a "1" was deposited in the outlier column.
Now it is again necessary to change the format so that the values are no longer in the form of arrays. To do this, we use the mv-expand operator.
# Show all IP addresses and the votes transmitted through them, in the
# matching time windows of 1h including the new outlier column (without
# leveraging arrays)

Votes
| where vote == "Poppy"
| summarize Count = count() by bin(Timestamp, 1h), via_ip
| summarize votesPoppy = make_list(Count), Timestamp = make_list(Timestamp) by via_ip
| extend outliers = series_decompose_anomalies(votesPoppy)
| mv-expand Timestamp, votesPoppy, outliers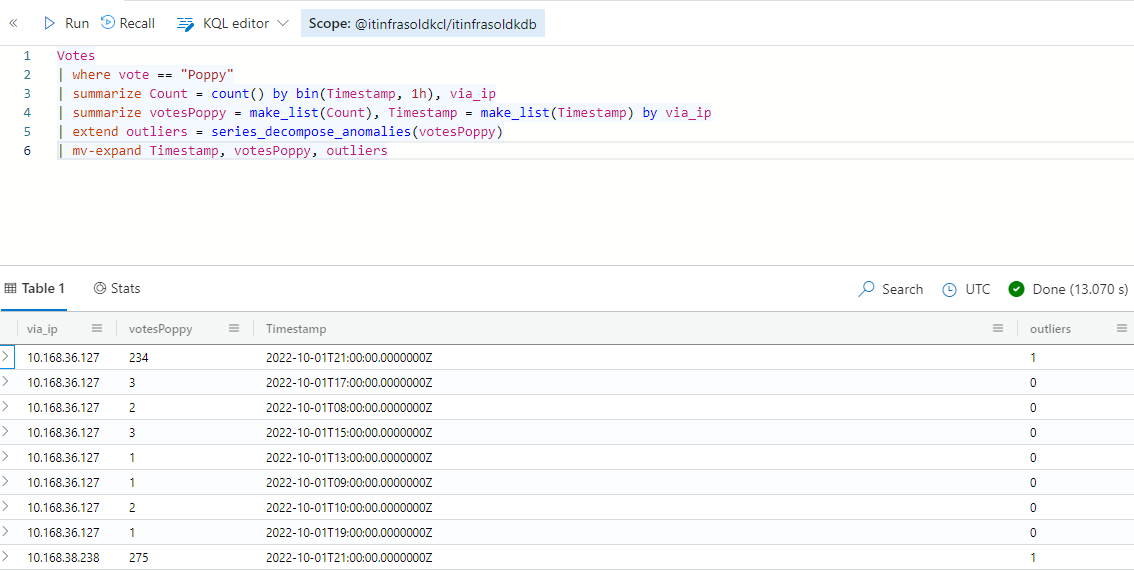
As we want to create a data set, which can be used to filter out anomalies, we select all lines with an outlier (value 1) and display the corresponding IP address.
For this, we use the where and distinct operator.
# Displays all IP addresses with an outlier
Votes
| where vote == "Poppy"
| summarize Count = count() by bin(Timestamp, 1h), via_ip
| summarize votesPoppy = make_list(Count), Timestamp = make_list(Timestamp) by via_ip
| extend outliers = series_decompose_anomalies(votesPoppy)
| mv-expand Timestamp, votesPoppy, outliers
| where outliers == 1
| distinct via_ip;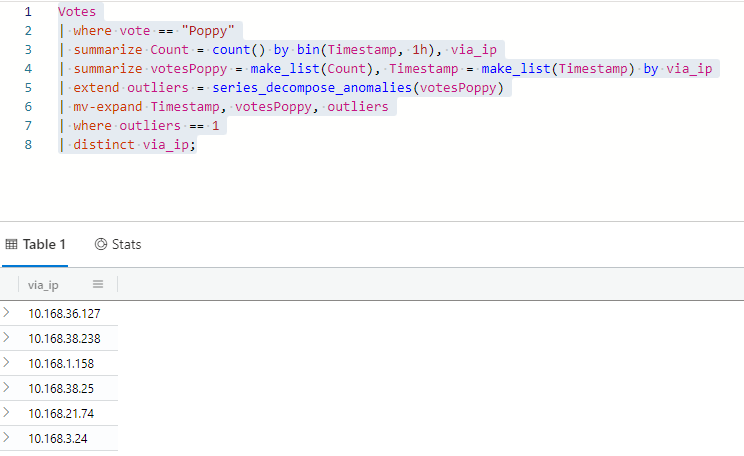
Das nun so erstellte Data Set filtern wir aus der ursprünglichen Auswertung aus.
let compromisedIPs = Votes
| where vote == "Poppy"
| summarize Count = count() by bin(Timestamp, 1h), via_ip
| summarize votesPoppy = make_list(Count), Timestamp = make_list(Timestamp) by via_ip
| extend outliers = series_decompose_anomalies(votesPoppy)
| mv-expand Timestamp, votesPoppy, outliers
| where outliers == 1
| distinct via_ip;
Votes
| where not(via_ip in (compromisedIPs) and vote == "Poppy")
| summarize Count=count() by vote
| as hint.materialized=true T
| extend Total = toscalar(T | summarize sum(Count))
| project vote, Percentage = round(Count*100.0 / Total, 1), Count
| order by Count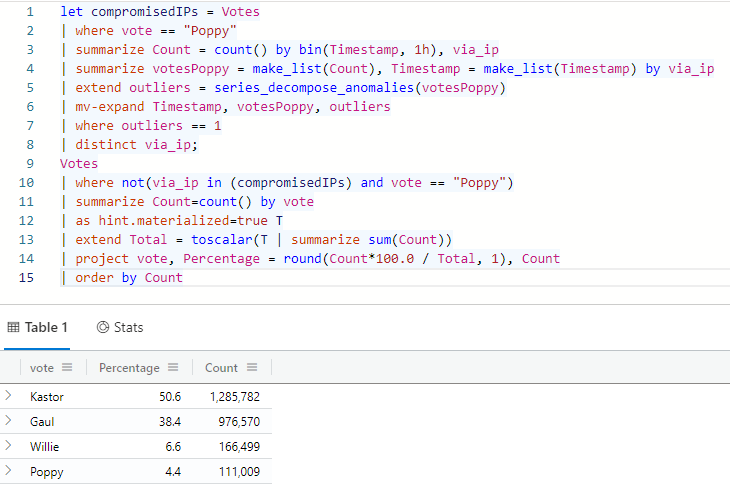


References:
Kusto Detective Agency: Challenge 2 – Election fraud in Digitown!
https://it-infrastructure.solutions/kusto-detective-agency-part1/